
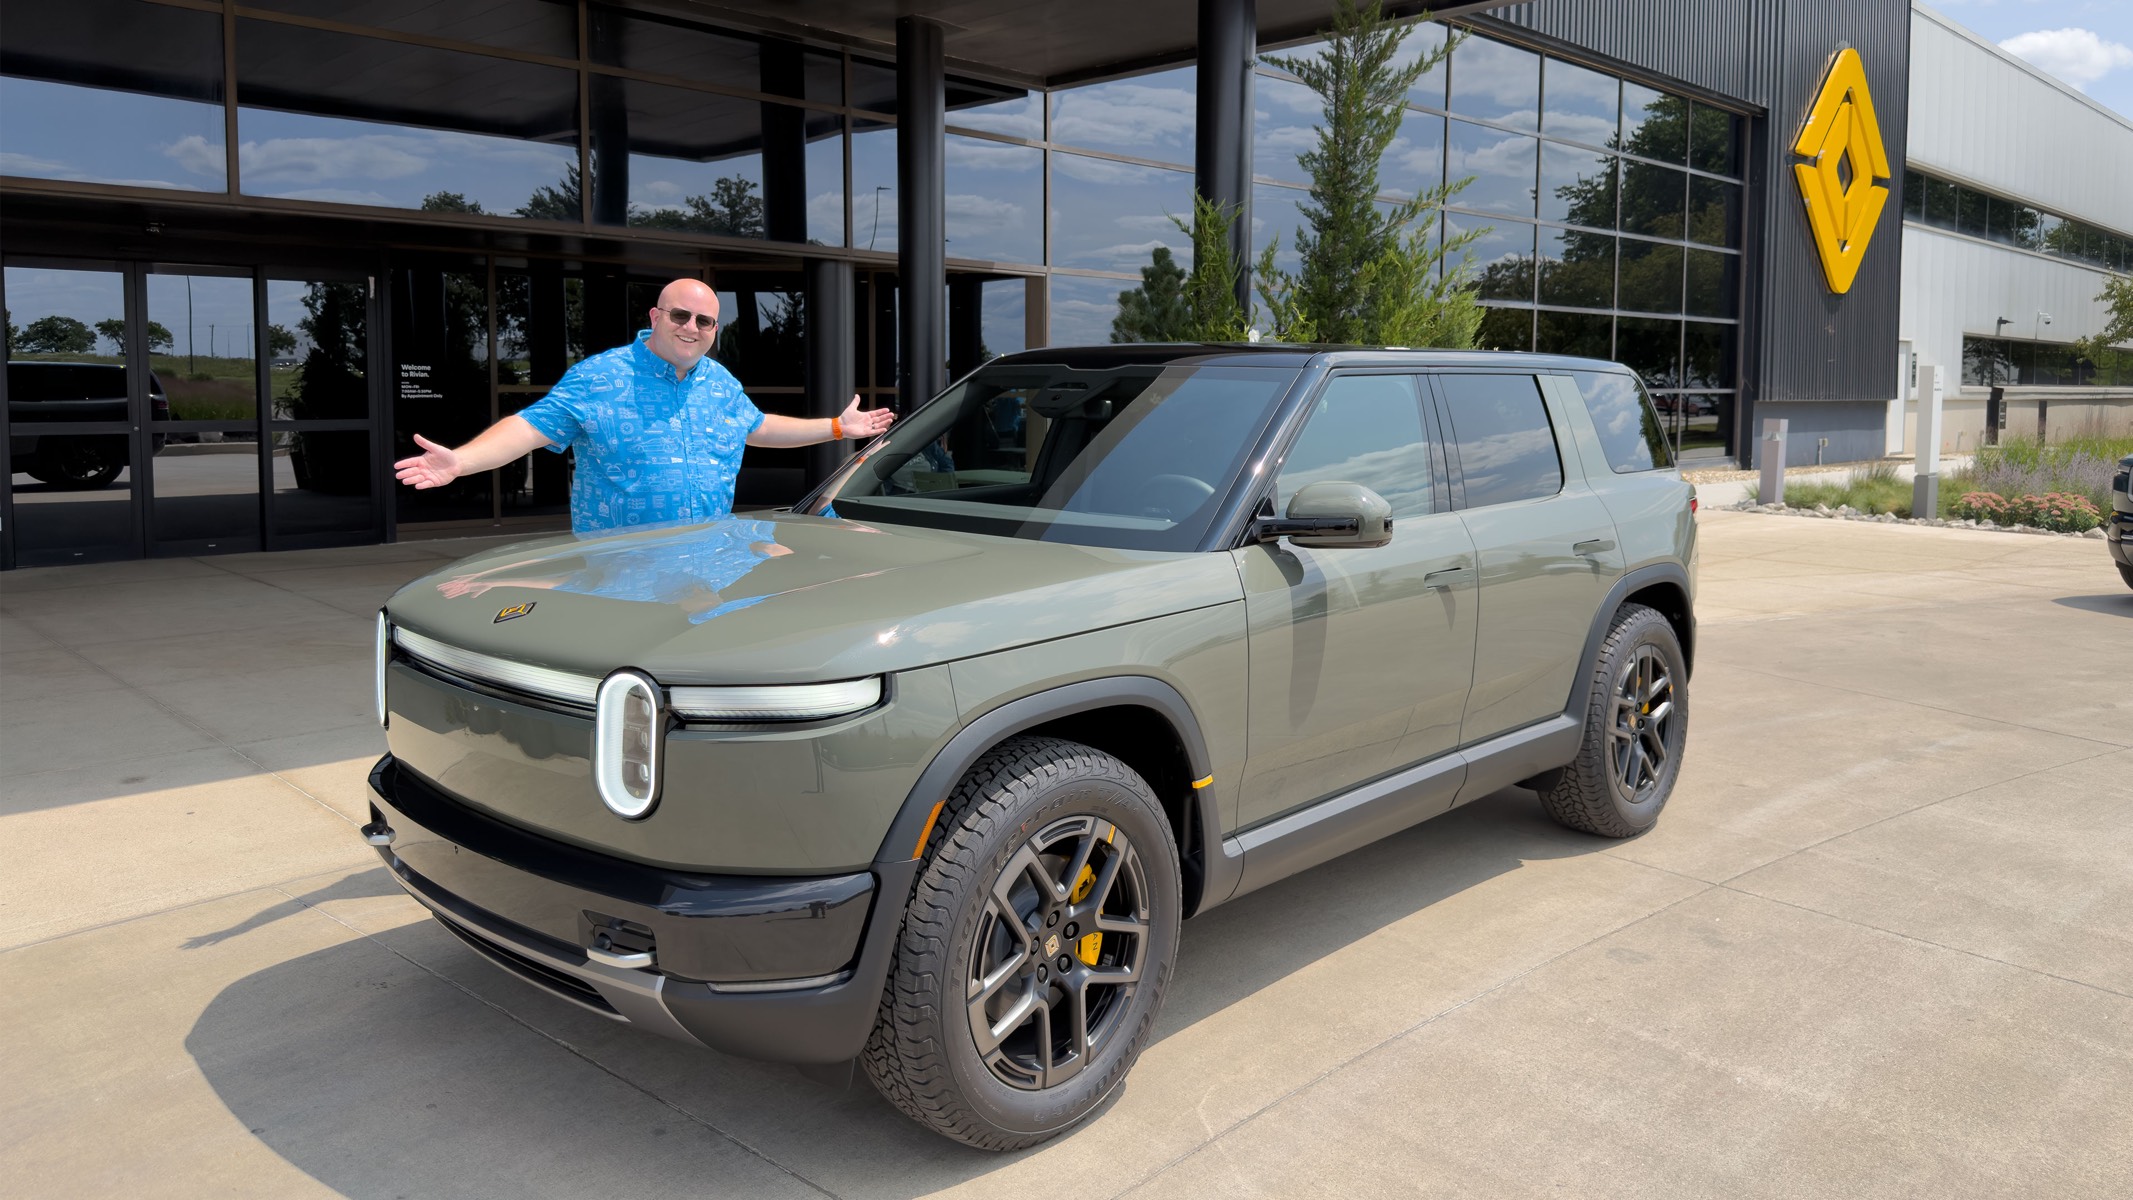
The Rivian R2 Performance is rated at 105 MPGe combined by the EPA. In our recent 70-mph highway test, it went a corrected 253 miles against a 330-mile rating, which is about 77%.
MPGe dates to 2010, when the EPA wanted a way to put electric cars on the same window sticker as gas cars so buyers could compare them. It landed on a fixed conversion, treating 33.7 kWh of electricity as the energy in one gallon of gasoline. After that, MPGe is just how many miles a car goes on that much energy. The R2 Performance uses 32 kWh to cover 100 miles, and that works out to 105 MPGe.
How the rating gets built is where it starts to drift from what owners see.
The first is where the energy gets counted. MPGe is a wall-to-wheels number. The EPA assumes Level 2 AC charging and accounts for energy losses in the charging cable and onboard charger, so the rating is measured at the wall outlet rather than at the wheels. The efficiency number the R2 displays on its own screen is a battery-to-wheels number and never accounts for any charging loss. On the R2, the gap is around 16%, so the sticker and the dash do not agree even before the car has turned a wheel.
The second is the driving. The combined rating mixes two lab cycles, weighted 55% city and 45% highway. The city cycle averages about 20 mph. The highway cycle averages just over 48 mph and never exceeds 60. Because more than half of the combined number comes from that slow city cycle, it leans on the driving where an EV does best, since the car recovers energy through regen every time it slows down. That is also the reason most EVs, including the R2, are rated for more range in the city than on the highway, which is the opposite of how gas cars behave.
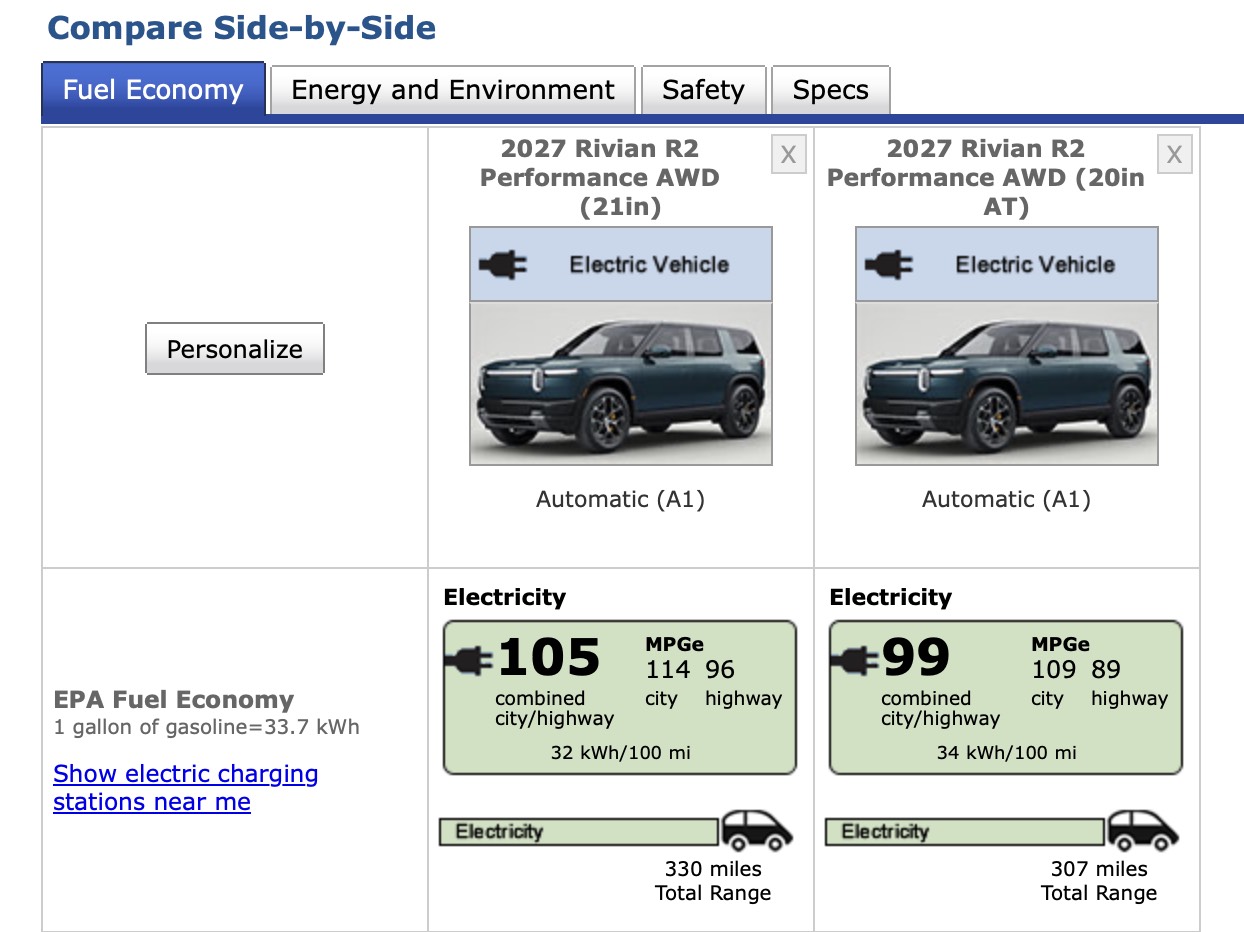
So the R2 numbers make more sense with that in mind. On the 21-inch wheels, the R2 Performance is rated at 114 MPGe in the city and 96 MPGe on the highway, which average out to 105 combined. In-range is 330 miles combined and 301 on the highway. Put in the miles per kWh owners actually read off the dash, the combined rating is about 3.1 miles per kWh at the wall, or a little over 3.7 miles per kWh at the battery once you set the charging loss aside.
The 70 mph test fills in the other side. It ran at a GPS-verified constant 70 on Interstate 64 in warm, still weather, next to a Model Y Performance on the same road at the same time. The R2 came back at a corrected 2.83 miles per kWh, with its own display showing 2.88. It pulled 89.3 kWh, a bit more than the 87.9 kWh Rivian lists as usable, and covered a corrected 253 miles before it could no longer hold the speed.
Lining the two up is where it gets easy to draw the wrong conclusion. On its face, 2.83 miles per kWh does not look far off. Run it through the 33.7 conversion, and it comes out near 95 MPGe, close enough to 105 that people assume the R2 nearly held its rating at 70. But 95 is a battery number, and 105 is a wall number, so it is not a fair comparison. Move the 70 mph result onto the same wall basis as the sticker, which means adding the charging loss back in, and it falls to somewhere around 80 MPGe. Judged the way the label is actually built, a steady 70 is costing the R2 close to a quarter of its combined rating.
And the highway rating alone, which ought to be the closer target, does not save it either. The 96 MPGe highway number is about 3.4 miles per kWh at the battery. The car did 2.83. That 17% difference is almost all speed. Drag goes up with the square of how fast you are going, so moving from a 48 mph test cycle to a real 70 mph cruise is expensive, and it costs more on a tall upright SUV than on something low and smooth. The R2 has a big flat front to shove through the air, and at 70 there is a lot of air to shove.
This is also where MPGe stops being a great shopping number, and the Model Y sitting next to the R2 shows why. Rivian has said the R2 matches the Model Y on efficiency, and on the sticker that holds up, because both Performance versions are rated at the same 105 MPGe combined. In the test itself, the Model Y went a corrected 310 miles and came in a little past its own 306-mile rating, while the R2 landed at 77% of its number. So two cars the EPA rates the same finished about 57 miles apart on the same drive, which is worth keeping in mind whenever the ratings say two EVs are even.
For an owner, the point is not that the sticker is lying. It’s answering a question a lot of road trips never ask. The 330-mile number is a blended, mostly low-speed cycle measured at the outlet. A long highway stretch at 70 or above lives a lot closer to the 2.8 miles per kWh the test saw, and on an 87.9 kWh pack, that puts real highway range down in the 240s. The last chunk of it goes faster than the odometer would suggest once the display starts falling off. This is not a Rivian thing either. Any boxy EV rated on these cycles will read high for the same reasons, and a slippery one will often beat its sticker on the highway for the opposite reason.
None of that makes the rating useless. It is average, and it does what it was built to do: let someone compare one EV against another on paper. It was just never meant to tell you how far you get at 70, and on a car shaped like the R2 those two are going to sit a fair way apart. So the real highway number keeps coming out of tests like this one instead of off the window, and probably will until the EPA decides to put a high-speed figure on the sticker itself.



This might be one of the coolest things you’ve written about all year! I had no idea how MPGe was calculated and how it factors into real life and faster driving. Thank you for teaching me something new!
Did you do this same test with your R1 vehicles??
Out of Spec did
Thanks for the explanation, Jose. The EPA needs to make some serious changes to its model, something I don’t expect to happen anytime soon. Until that happens, EV consumers need to educate themselves through channels such as RivianTrackr, Out of Spec, and State of Charge so we can see real-world testing.
Nice write up.
Thanks. Rivian played the shell game with the EPA testing options and on the window sticker they won. However, they were humbled on the issue that matters most. How far can I drive my R2 at 70mph.
If the target audience was always the Model Y, then why not use the same testing standard? The answer is obvious, they would have lost on both fronts then and not on a single solitary one.
We can spin this however we want, but the truth is it’s over 50 Mi short of the Y, which has a smaller usable battery.
Thank u for the really insightful & detailed explanation.
I guess the old adage, you can’t defy physics is command the day.
While that all makes sense, ultimately it makes for a poor non-technical non-EV understanding user experience. The EPA test being dumb, and allowing manufacturers to choose test cycles and other games is dumb, but ultimately trust between a manufacturer and consumer that what it says on the tin is what’s inside is not something that can be explained away with technicalities.
That being said, any thoughts on what’s up with SoC getting ~265 miles and 3m/kwh from a 20″ AT equipped R2 vs. your results with OoC? I can imagine many little things, but to me none stand out as obviously big enough to cause such a swing, but perhaps the answer is in the aggregate…
(higher elevation, cooler weather, no passenger, smaller wheels, “AT” tires which may not actually be significantly All Terrain)
Great write-up, Jose. Your closing line — that the real highway number will keep coming from road tests until EPA puts a high-speed figure on the sticker — sent me into the certification data, and here’s the surprise: the inputs needed to derive that figure are already filed and public. Before the lab test ever runs, every automaker coasts its car down on a track and files three road-load coefficients with EPA; the dyno is then programmed to replicate exactly that resistance. The filing (EPA’s public test-results data) is the physics behind the EPA ratings.
Rivian’s filing for this car does two things. Run it through the label recipe — highway cycle at ~48 mph, powertrain and charging losses, the adjustment factor (commonly 0.7) — and you land within a few percent of the 96 MPGe sticker. The label is the standard process applied to an honest measurement; no “sweet test” required. Run the same filing at a steady 70 with real-world losses and summer AC, and it predicts roughly 2.8–2.9 mi/kWh and 250–260 miles. You measured 2.83 and 253. That number was derivable from public certification data before the first R2 shipped.
It extends to other speeds too — my model, not an EPA figure, anchored to your 253: about 280 miles at 65, ~230 at 75, ~210 at 80. The 80 cross-checks against Out of Spec’s separate test (2.2 mi/kWh on a heat-soaked pack versus ~2.3 predicted). Two independent road tests, both landing where the paperwork said they would.
Two details worth noting. First, the R2’s speed-squared term — the one dominated by aero — is a wash against everything Tesla has filed for the Model Y Performance (0.0164 versus 0.0160–0.0169 across the 2021–2025 filings). The R2’s penalty concentrates in the speed-proportional term, mostly tires and driveline: 0.54 lbf/mph against 0.13–0.32 in every Tesla filing, about 27% of its total road load at 70. Coefficients bleed together in the curve fit, so treat that as suggestive — but as filed, the rolling hardware looks like as much of the story as the big flat front. Second, the refreshed Model Y’s own coefficients aren’t visible yet: the Performance joined its test group via a May certificate revision, and its road-load data hadn’t hit EPA’s public release when I pulled it. So today’s 105-vs-105 sticker parity may just compare the R2 against pre-refresh paperwork?
The upshot strengthens your conclusion: EPA may not need a brand-new road test to add an interstate-speed range estimate to the sticker. The data needed to derive one is already filed and public — both road tests landed on what it predicts. They’d still need to standardize the assumptions, but the physics is already sitting in the EPA records.
F= ma
All else is Greek
Great explanation!
Much more comprehensive than my response to ICE drivers who ask about range. “It depends . . . .”
Thanks for correcting things. I love OOS and the effort you guys put in for the 70mph test, but the way you and Kyle presented the data caused significant confusion and led many people to make car decisions based on incomplete information. I understand that this wasn’t Kyle’s or your intention, but both of you should create a video to provide a more accurate and comprehensive overview of the R2 range to address the chaos you unintentionally caused.
All cars/trucks, ICE or EV have the same issue: air resistance goes up with speed, range/ milage goes down. Why this is mysterious to people is beyond me.
Exactly!
This statement in the last paragraph: “None of that makes the rating useless. It is average, and it does what it was built to do: let someone compare one EV against another on paper.” is in opposition to your earlier statement in the entire paragraph that starts with “This is also where MPGe stops being a great shopping number, and the Model Y sitting next to the R2 shows why.”
I agree with Kyle’s take in the video (watched the whole thing and thanks for loaning your R2 for these videos!) where he discredits the EPA labeling process as it currently stands. This test is a great example of why EPA numbers should be taken with a +- 25% grain of salt.